In finance, people love to pretend that everything is rational. There is a strategy, an entry rule, an exit rule, a nice backtest. On paper, everything is “perfect”. But in real life, between the rule and the “buy” button, there is a human being. And a human being does not execute a system perfectly. They hesitate, delay the exit, add risk after a winning streak, and postpone decisions when they should act.
In this case, I took a simple baseline strategy: SPY (the exchange-traded fund tracking the S&P 500 index) with a 200DMA rule (200-day moving average: if the price is above it, we are in the position; if it is below, we go to cash). I did not change the market. I changed only the behavior of the person executing the strategy. So on top of the same strategy, I layered four typical cognitive biases and looked at what they did to the result.
The outcome was stronger than I expected. Two biases barely damaged the system. Two others made it worse. One produced a very strong positive effect. And the combination of all four created a strange but logical result: the strategy almost turned into buy and hold and made only one trade over the whole period.
Which models I tested
I do not like talking in vague terms about “emotions in the market”, so I translated each bias into a clear rule that can be programmed. In other words, each psychological phenomenon became a separate behavior model.
1. House money effect: after a streak of winning days, the trader increases position size. In the model, after 3 winning days in a row, the position is increased by 1.5 times.
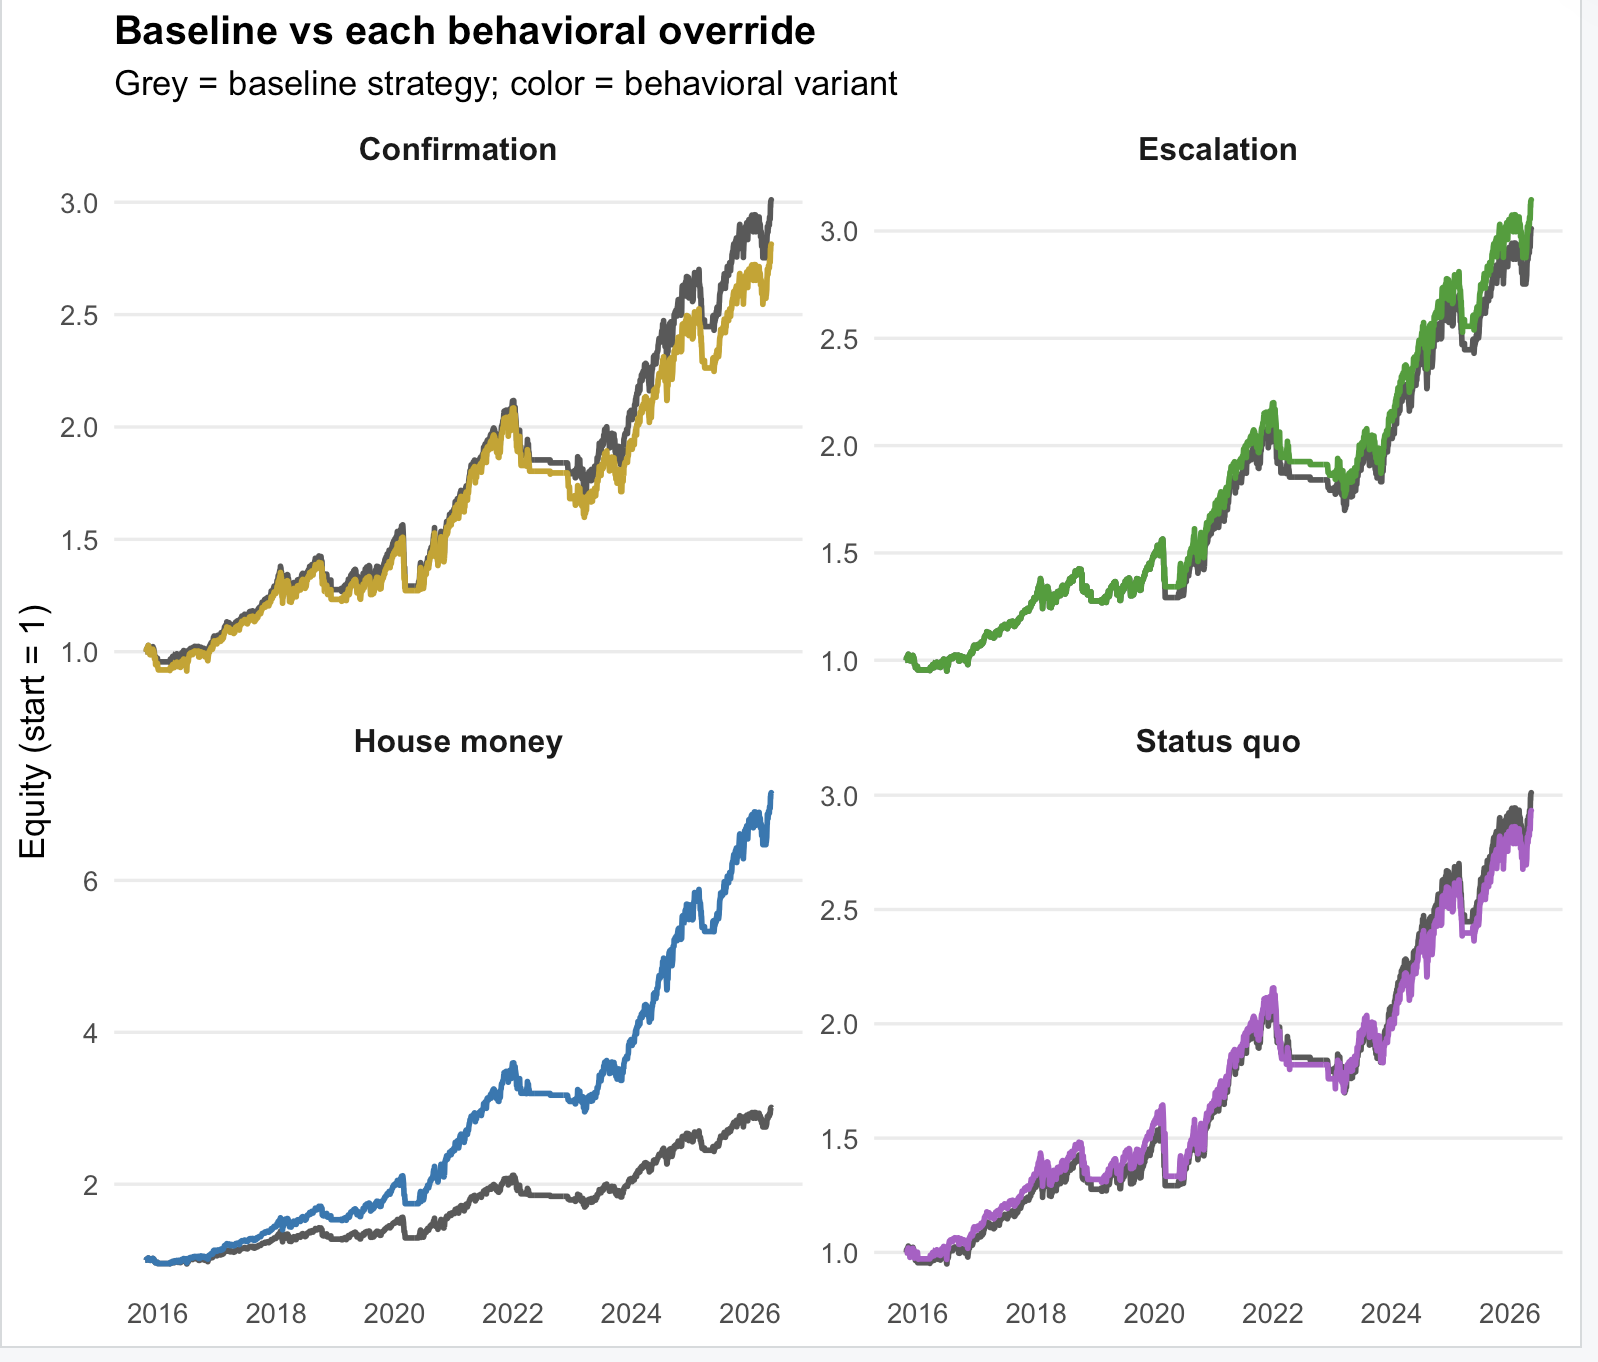
2. Confirmation bias: the trader ignores the first exit signal because they want confirmation that exiting is really necessary. In the model, the first “sell” signal is skipped.
3. Escalation of commitment: when a position is already in the red, it is psychologically hard to admit the mistake, so the person sits through the loss. In the model, the exit is delayed if drawdown is greater than -8%.
4. Status quo bias: changes are delayed simply because doing nothing feels psychologically easier. In the model, the signal is triggered only after 3 days of confirmation.
5. Combined: all four biases work at the same time, as often happens in real life.
What matters here is this: I am not trying to prove that biases are “always bad”. I am showing that they change the execution of the system. And then the market decides whether that change works in your favor or against you.
What the results showed
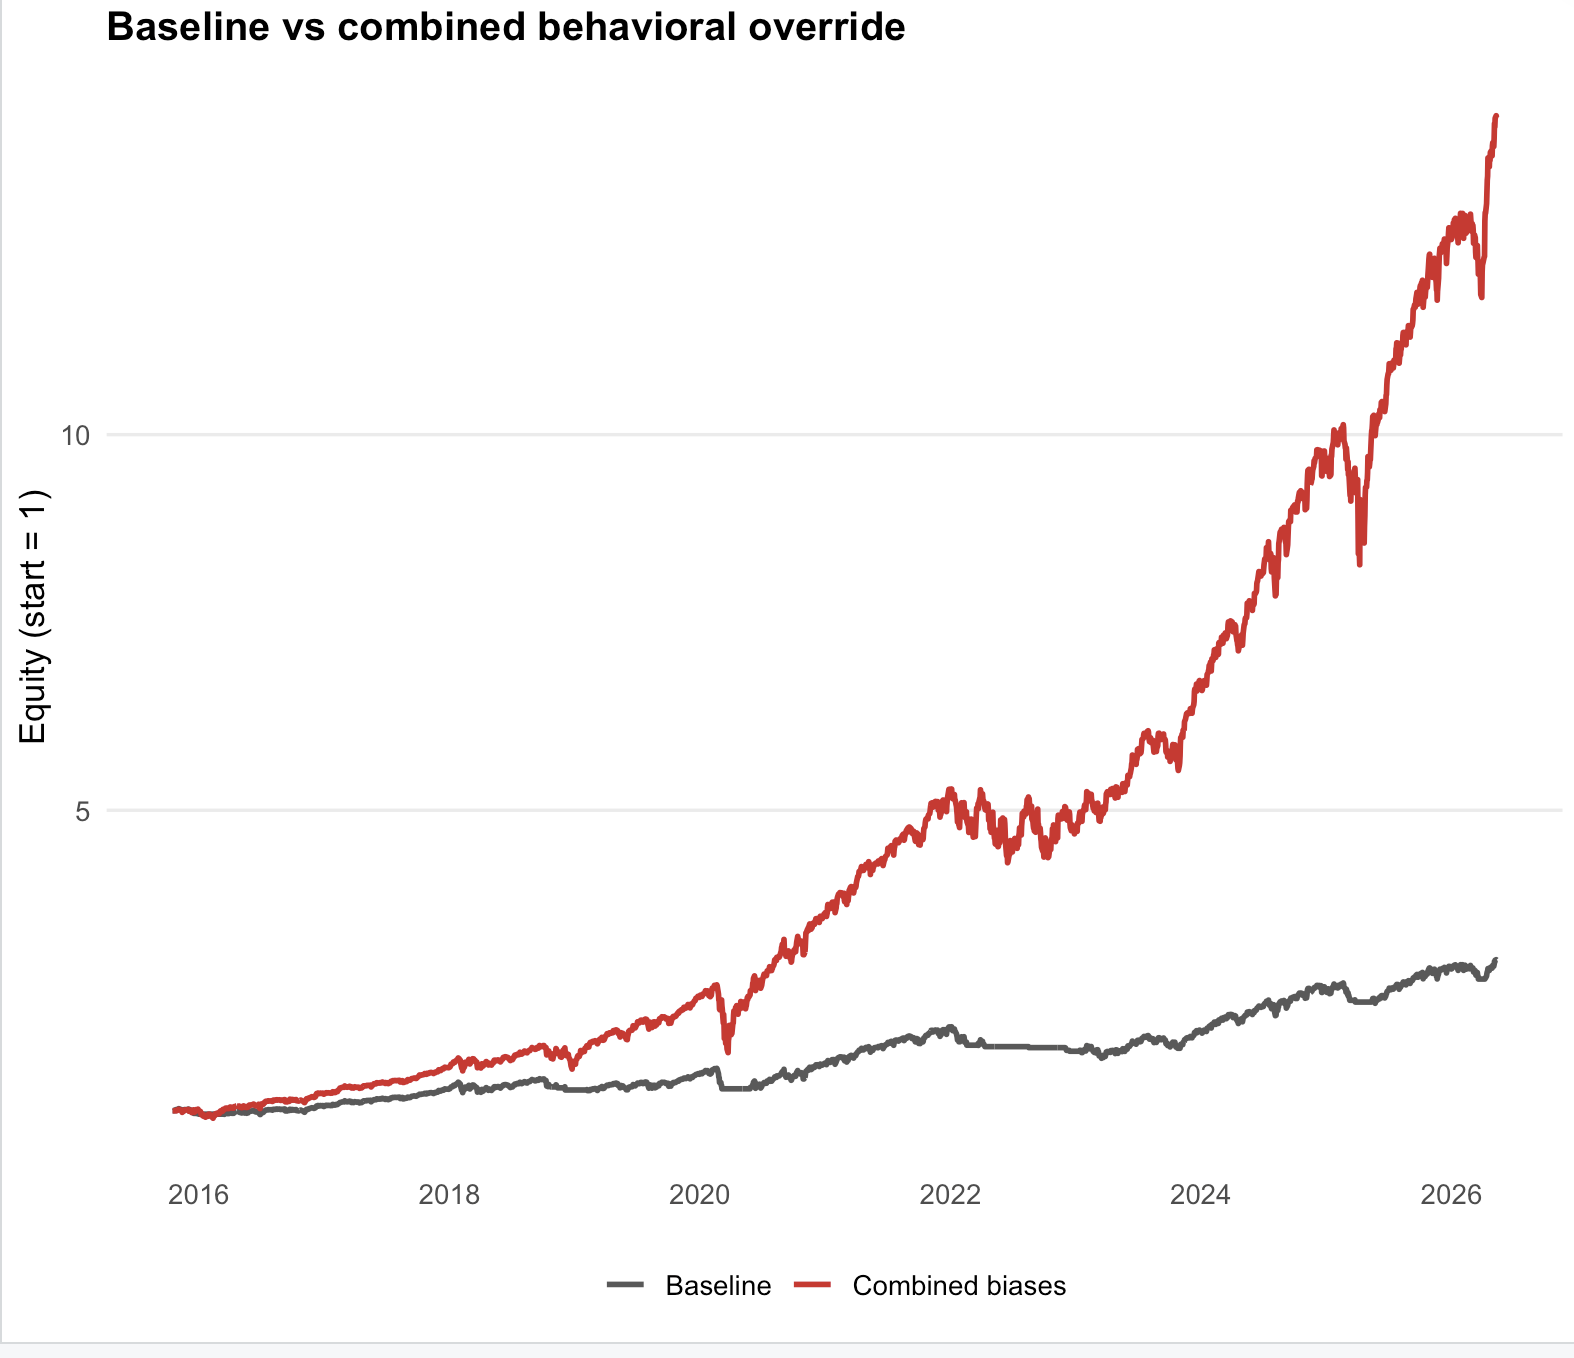
The strangest observation is this: the highest return did not come from the rational baseline model, but from the combined model, where all biases worked together. But that is exactly the interpretation trap. If you look only at CAGR, you can draw the wrong conclusion.
Here are the actual results that came out of the model:
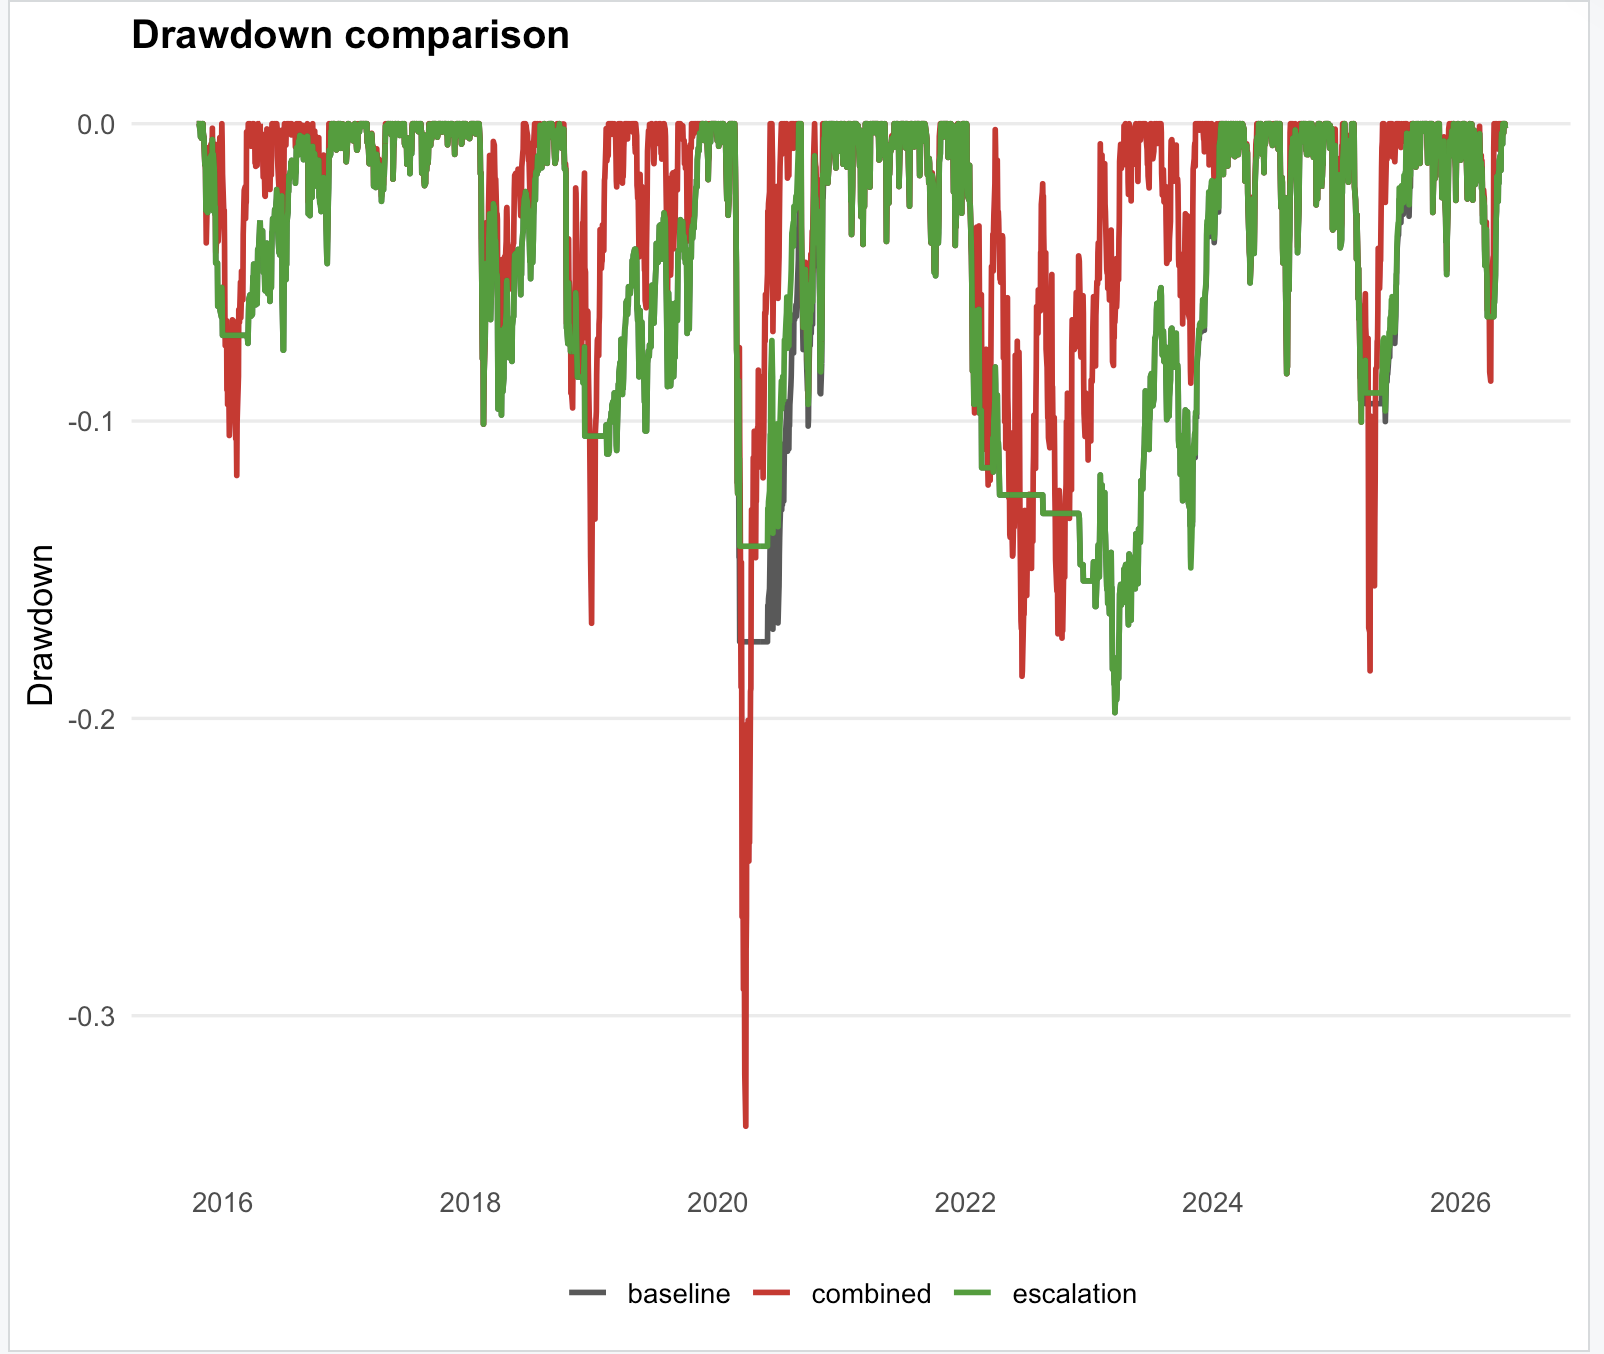
Combined: CAGR 28.6%, Sharpe ratio (quality of return relative to risk) 1.53, MaxDD (maximum drawdown) 33.7%, 1 trade, Terminal Wealth (ending capital if starting from 1) 14.2.
House money: CAGR 20.5%, Sharpe 1.64, MaxDD 17.9%, 31 trades, Terminal Wealth 7.14.
Escalation: CAGR 11.5%, Sharpe 0.96, MaxDD 19.8%, 30 trades, Terminal Wealth 3.14.
Baseline: CAGR 11.0%, Sharpe 0.93, MaxDD 19.8%, 31 trades, Terminal Wealth 3.01.
Status quo: CAGR 10.7%, Sharpe 0.87, MaxDD 21.1%, 14 trades, Terminal Wealth 2.93.
Confirmation: CAGR 10.3%, Sharpe 0.85, MaxDD 23.3%, 25 trades, Terminal Wealth 2.81.
At first glance, combined looks like the winner. But the model made only 1 trade in 11 years, and this is not a “better trading system”. It is almost a different behavior logic. It simply entered the market and barely exited. In other words, the combination of biases here created a behavioral lock-in.
So the main conclusion is this: you cannot evaluate behavioral models only by profitability. You need to look at the mechanism, and even better, the context. Why exactly did the model make money? Because of better execution? Or because it effectively switched off exit discipline?
What this means for an ordinary trader or investor
House money effect worked well in this case. This means that when the market is already rising and a person increases their position after a streak of wins, they can earn more than the baseline system. But this is not a “life hack for all markets”. It works while the asset has a strong upward trend. In a flat market or a prolonged decline, the same behavior will destroy capital.
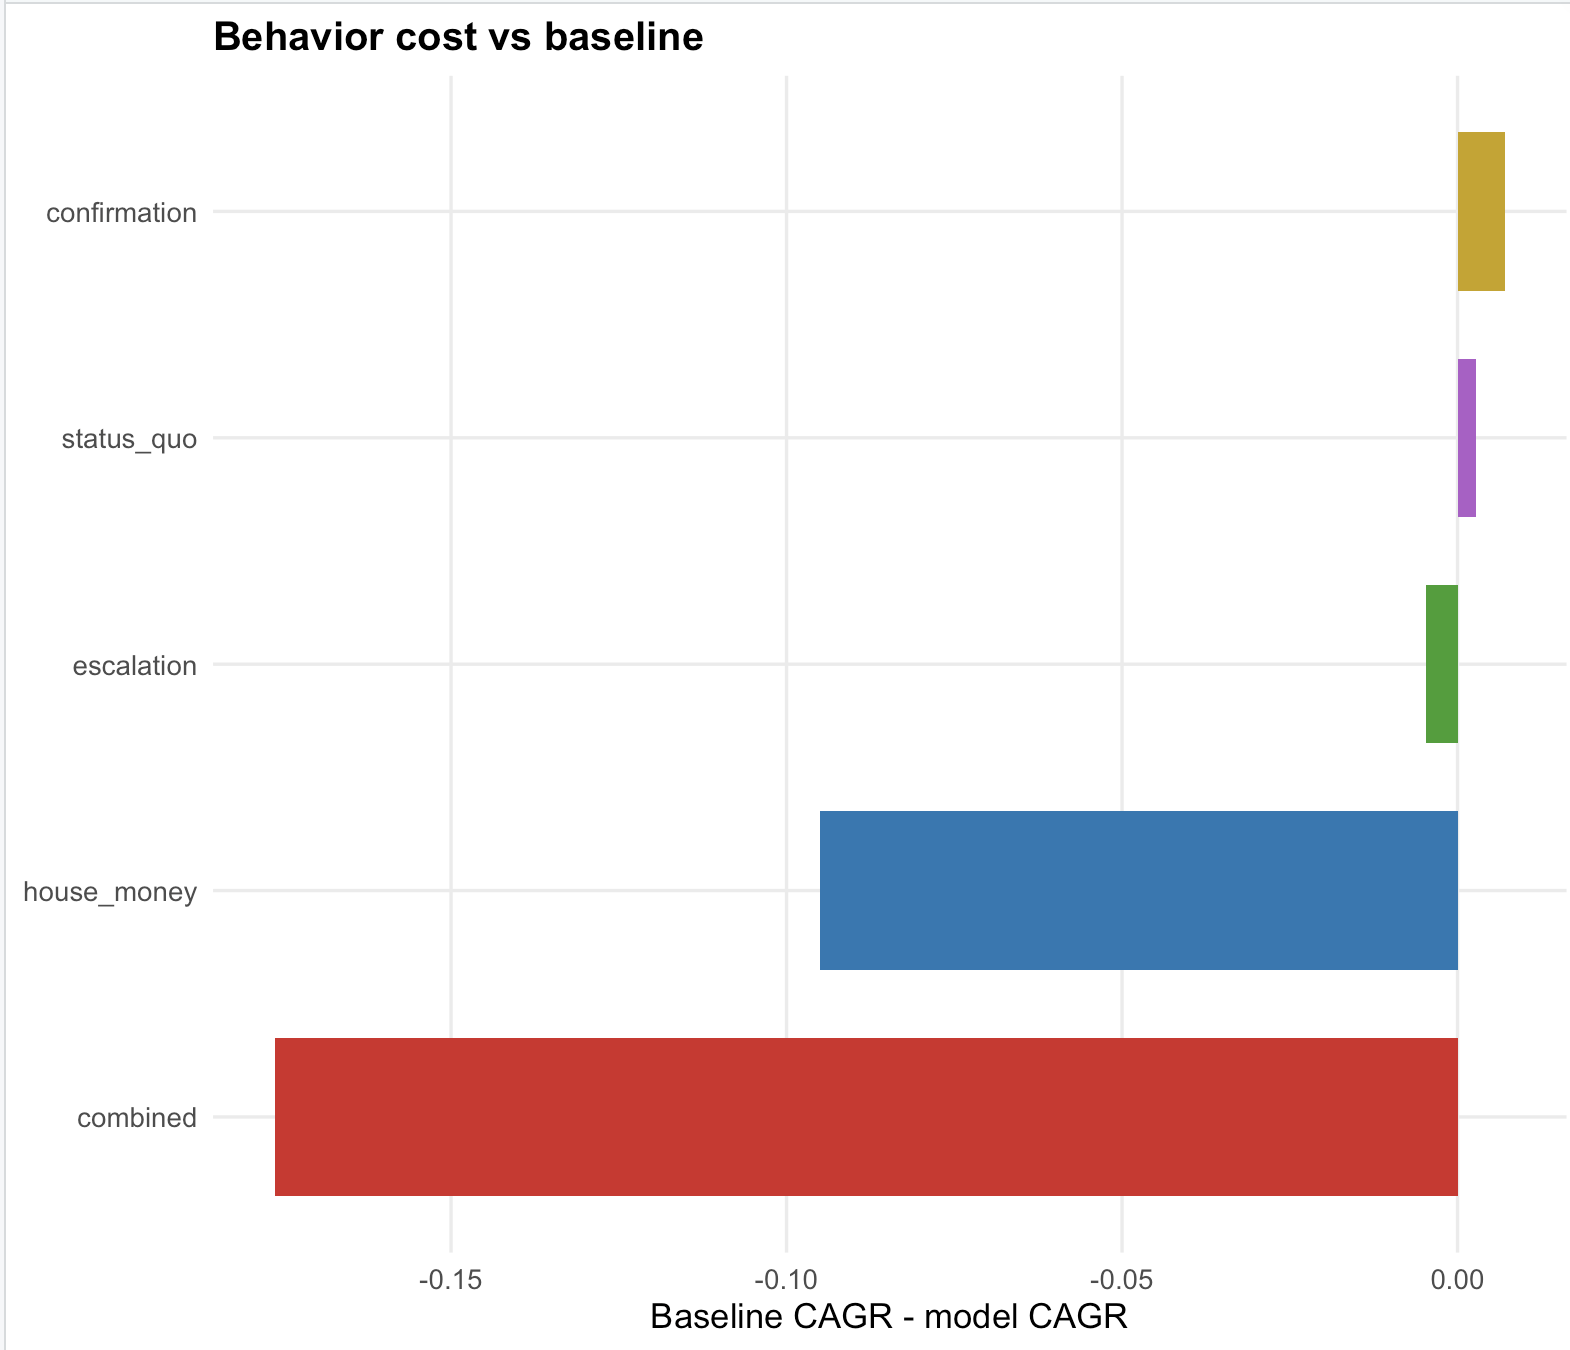
Confirmation bias turned out to be pure damage. When a person delays the exit and wants one more confirmation, they do not become smarter — they simply exit later and at a worse price. In the numbers, it may not look dramatic, but over a long period even minus 0.7 percentage points per year makes a big difference in terminal wealth.
Status quo bias also hurts, though more mildly. When you delay a decision simply because acting is psychologically uncomfortable, the market does not wait. And if a strategy has a rule, its value lies precisely in the fact that it must work on time.
Combined is the most dangerous story. It does not show the “superpower of biases”, but rather how several weak behavioral shifts together can completely change your system. This is exactly how people sometimes sit in a position for years and call it “long-term vision”, when in reality they lost the ability to exit long ago.
What fintech business can take from this
The interface is not neutral. If your app nudges the user to increase risk after wins, makes selling harder than buying, hides negative metrics, or does not remind them to review a position, then you are not simply “improving engagement”. You are programming behavioral deviation. Sometimes it will lift profitability in a bull market, but together with that it will increase the risk of a very sharp and painful collapse.
For a trader, the most dangerous mistakes do not look like mistakes. They look like “I’ll wait a little longer”, “I’ve already been through so much with this position”, “the market will confirm it”, “after three positive trades I can add risk”. In other words, they feel very logical in the moment. That is why you need either automatic execution rules or at least strict limits defined in advance.
For risk and compliance teams, this is a direct argument that bias-as-a-feature is a risky idea. If a product systematically pushes a client toward decisions that increase drawdown, position concentration or delay exit, then it is no longer just a UX issue. It becomes a question of the company’s responsibility for the choice architecture it creates.
A separate opportunity for fintech is behavioral analytics: not just showing the user profit and risk, but showing them their error style — you delay exits, you increase risk after a streak of wins, you freeze in drawdown, you avoid changing the portfolio. That is no longer just a dashboard, but a behavioral mirror.
Charts and code
baseline <- SPY %>%
  fortify.zoo() %>%
  as_tibble() %>%
  transmute(
    date = as.Date(Index),
    adjusted = SPY.Adjusted,
    ret = adjusted / lag(adjusted) - 1
  ) %>%
  mutate(
    sma200 = SMA(adjusted, n = 200),
    raw_signal = if_else(adjusted > sma200, 1L, 0L, missing = 0L),
    signal = lag(raw_signal, 1, default = 0L),
    position = signal,
    strategy_ret = position * ret
  )
The point of this case is not that “people are irrational”. That is too banal. The point is that irrationality can be described as a mechanism, tested as a model and translated into concrete product, investment and risk decisions. And that is exactly where the real value of behavioral finance begins.