Fintech products increasingly face not a lack of data, but a lack of behavior change. Younger users want financial stability, an emergency fund, and more control over money, yet in real life they often act under the influence of impulse, social pressure, and short-term emotional cues.
This case models an A/B experiment for a digital bank / PFM app that launches a AI-Based Spending Insights & Nudges feature. The objective is to test whether a personalized layer of spending insights can reduce the discretionary spend share without harming essential spend and without reducing engagement with the app.
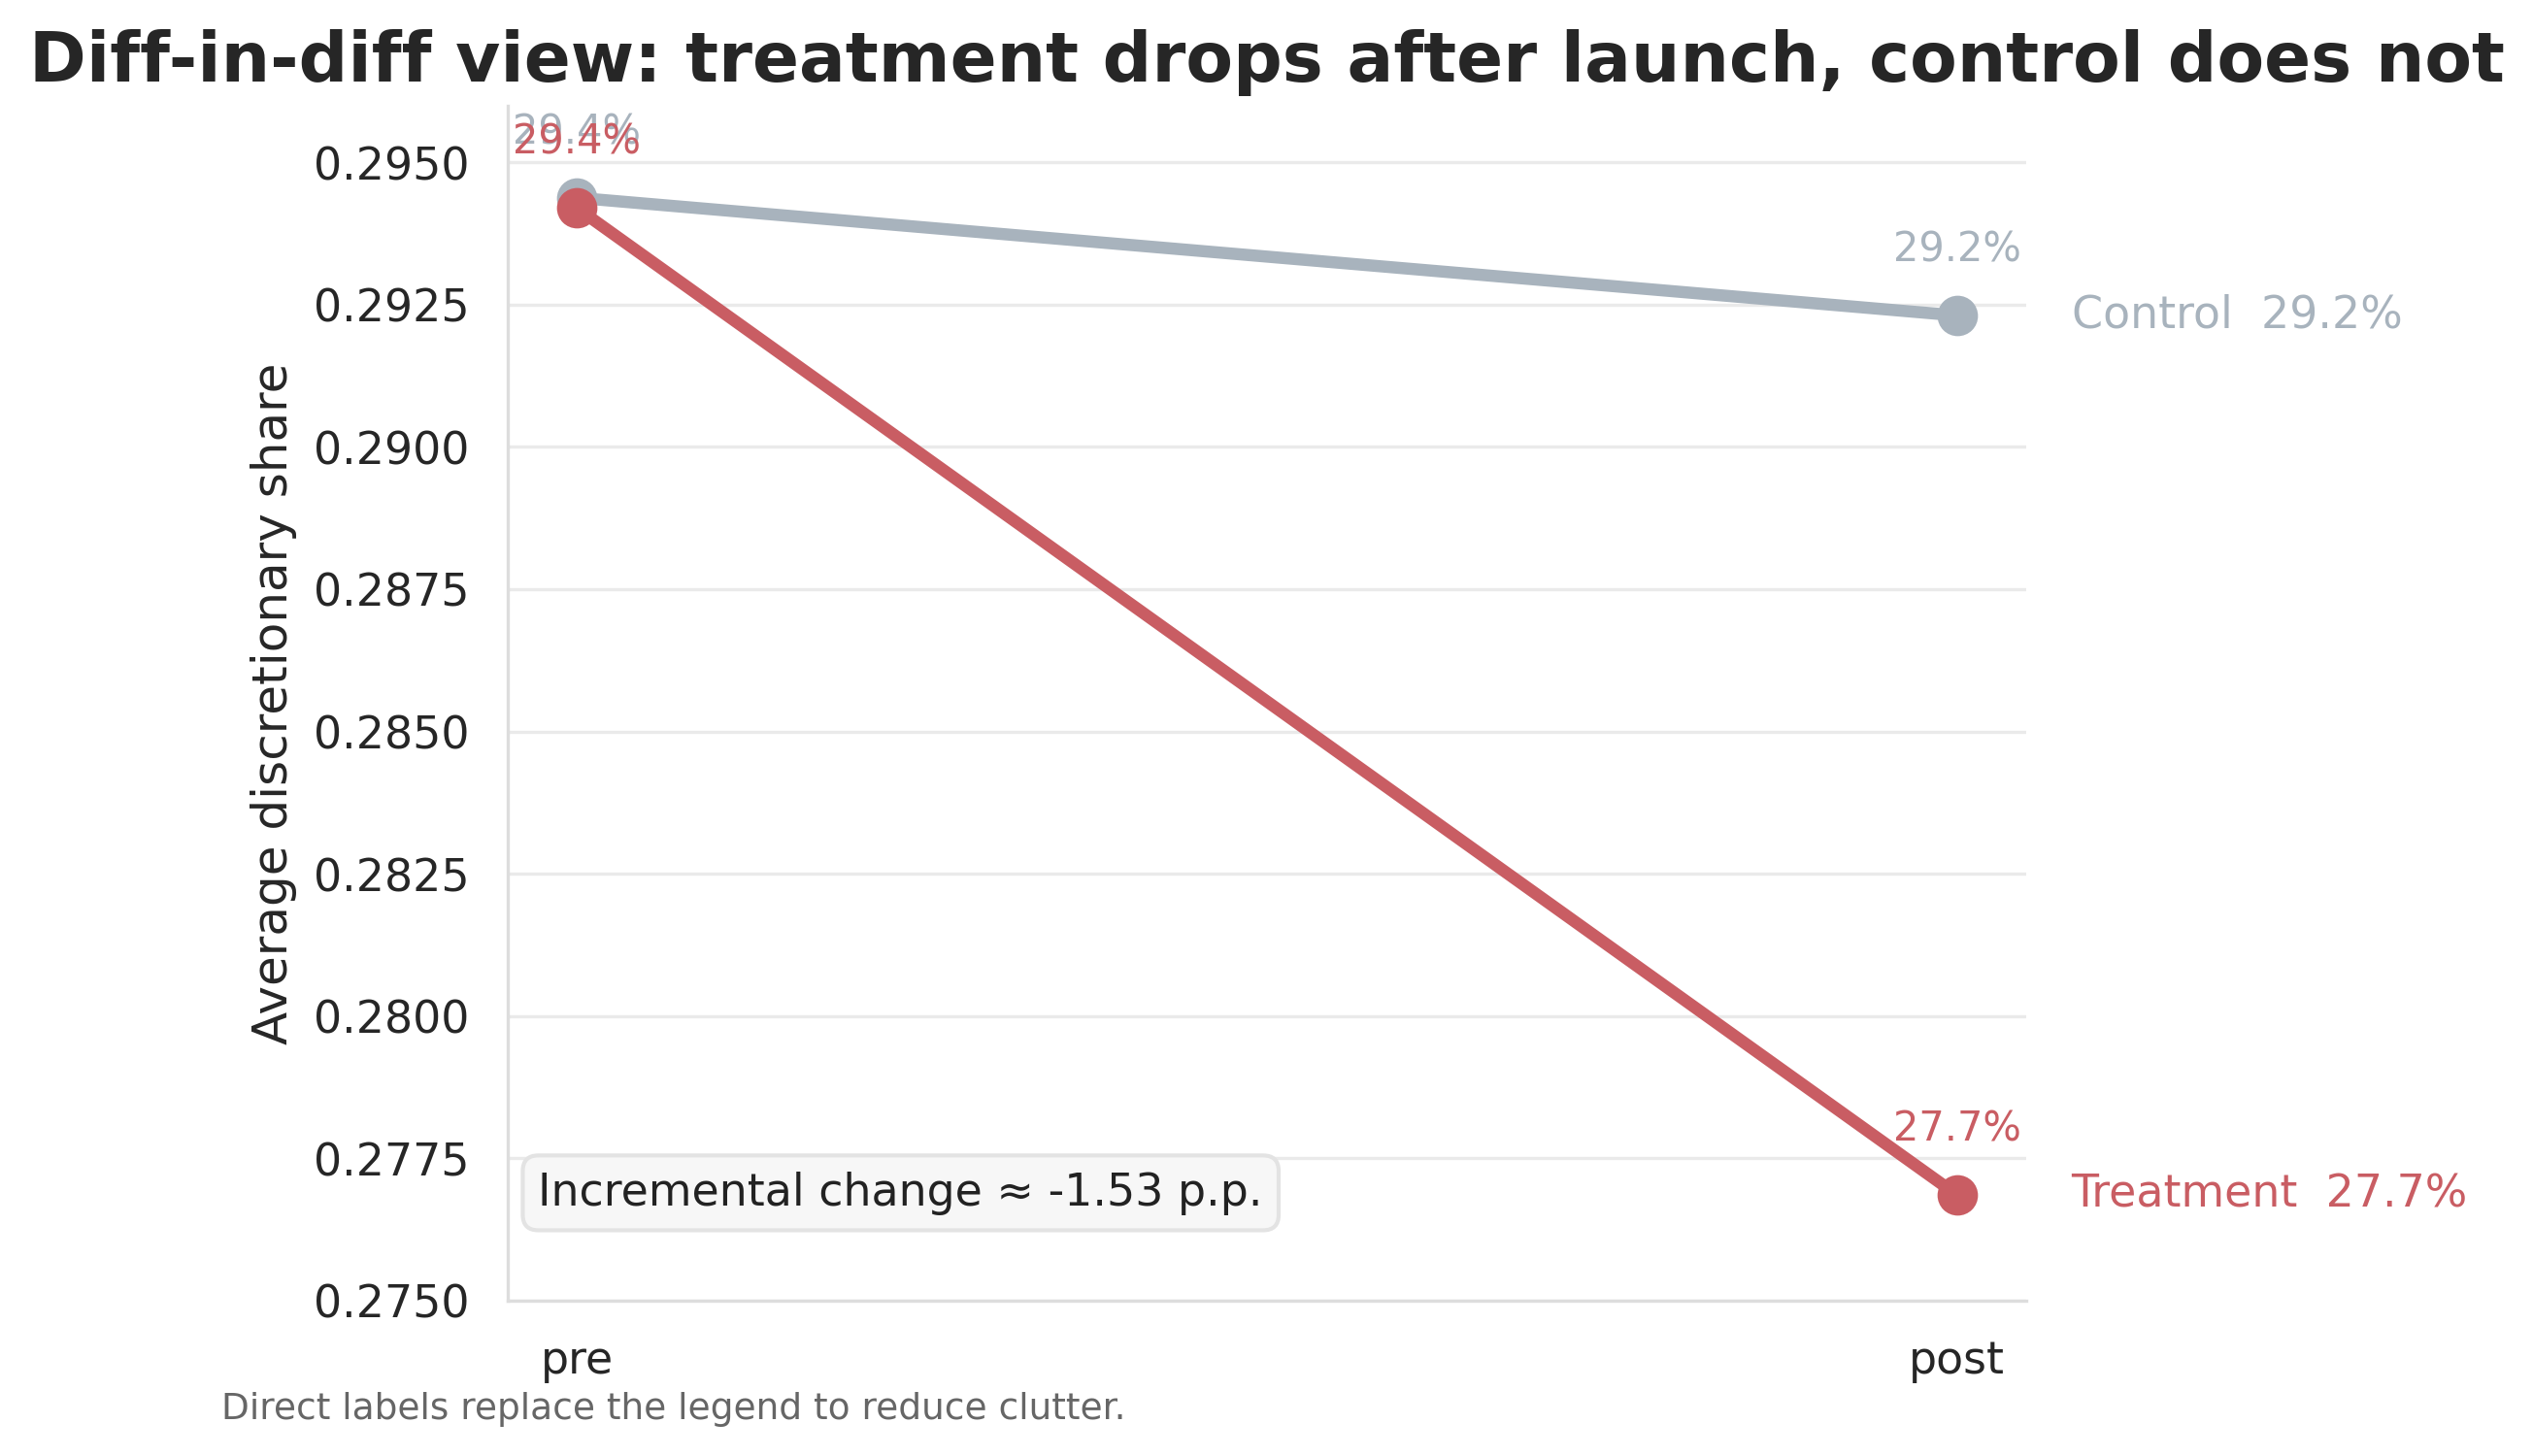
In the simulated experiment, the treatment group reduced its discretionary share by 1.53 percentage points relative to control, while sessions per user did not drop and interest in the insights screen increased substantially. This makes the case not just statistically interesting but product-relevant for a fintech environment where any behavior-change feature has to show effect, safety, and adoption at the same time.
Why this is a real product problem
For Gen Z and younger millennials, the conflict between wanting stability and how they actually behave is especially visible. The mobile interface becomes the primary channel through which a bank or PFM service can influence financial habits, because daily interaction with money happens not in a branch but in an app.
At the same time, the financial resilience of this audience remains limited. This means even small everyday decisions can have a disproportionately large impact on their sense of control, stress, and progress toward goals.
The social context also actively pushes toward consumption. The spending environment is increasingly instant, frictionless, and behaviorally provocative, which means a fintech product has to work not only as a ledger, but also as a behavioral interface.
Product hypothesis
At the center of this case is an AI-Based Spending Insights & Nudges feature for a mobile banking / personal finance app. It analyzes a user’s spending structure, identifies discretionary categories — eating out, entertainment, shopping, travel — and generates personalized insights and soft nudges that do not forbid spending but show the price of the current patterns in terms of savings goals, control, and financial resilience.
The simple version of the product hypothesis is: if discretionary spend becomes more salient and tied to personal goals, the user can slightly adjust their spending mix. But for the business this is not enough. The feature is considered successful only when three conditions are met at once: it lowers the discretionary share, it does not harm essential spend, and it does not reduce engagement with the app.
Behavioral framework of the case
The strength of this case is not just the A/B analysis, but the attempt to build a more realistic user model. Instead of a flat design like “there are different incomes and segments”, the synthetic data embeds latent behavioral traits that mirror well-known patterns of financial behavior from research.
- FOMO susceptibility amplifies discretionary behavior: higher shares of spending on entertainment, eating out, shopping, and travel, plus a higher frequency of impulsive transactions.
- Status seeking models conspicuous consumption — spending that serves a social signaling function.
- Financial stress models fragility, higher volatility of spending, and greater sensitivity to control tools.
- Stability need reflects the desire for order, an emergency fund, safety, and predictability.
- Goal orientation models the ability to think about finances in terms of goals and systems, not just current wants.
This framework makes it possible to look not only at the average treatment effect but also at heterogeneity: who the feature works better for, who is more likely to adopt it, and where a different communication approach is needed.
Experiment design
The experiment is built as a user-level randomized controlled trial, which mirrors how product experimentation actually works in mobile financial services.
| Element | Case design |
|---|---|
| Randomization level | User |
| Time horizon | 3 months pre + 3 months post |
| Sample size | 10,000 synthetic users |
| Treatment | v2_AI_insights with access to insights and nudges |
| Control | baseline product without spending insights |
| Primary metric | Discretionary share of spend |
| Guardrails | Essential share, transactions, volatility, sessions |
| Mechanism metrics | Adoption, insights views, engagement |
The primary metric in this case is the discretionary share — the share of spending on discretionary categories out of total spend. This is more product-relevant than simply tracking a drop in total spend, because it lets you evaluate changes in the structure of behavior rather than just “belt-tightening”.
Guardrails are critical. The success condition here is not just a positive DiD on discretionary share, but a positive DiD with no harm to essentials and engagement.
Technical notes on generation and analysis
Three core tables were created: users.csv — treatment assignment, segments, demographics, latent traits; transactions.csv — spend by category, amounts, pre/post periods; sessions.csv — app activity, views, interaction with insights.
The statistical layer uses user-level pre/post aggregation, Welch’s t-test on user-level deltas, diff-in-diff regression for incremental treatment effect, and logistic regression for modeling adoption in the treatment group.
What the experiment showed
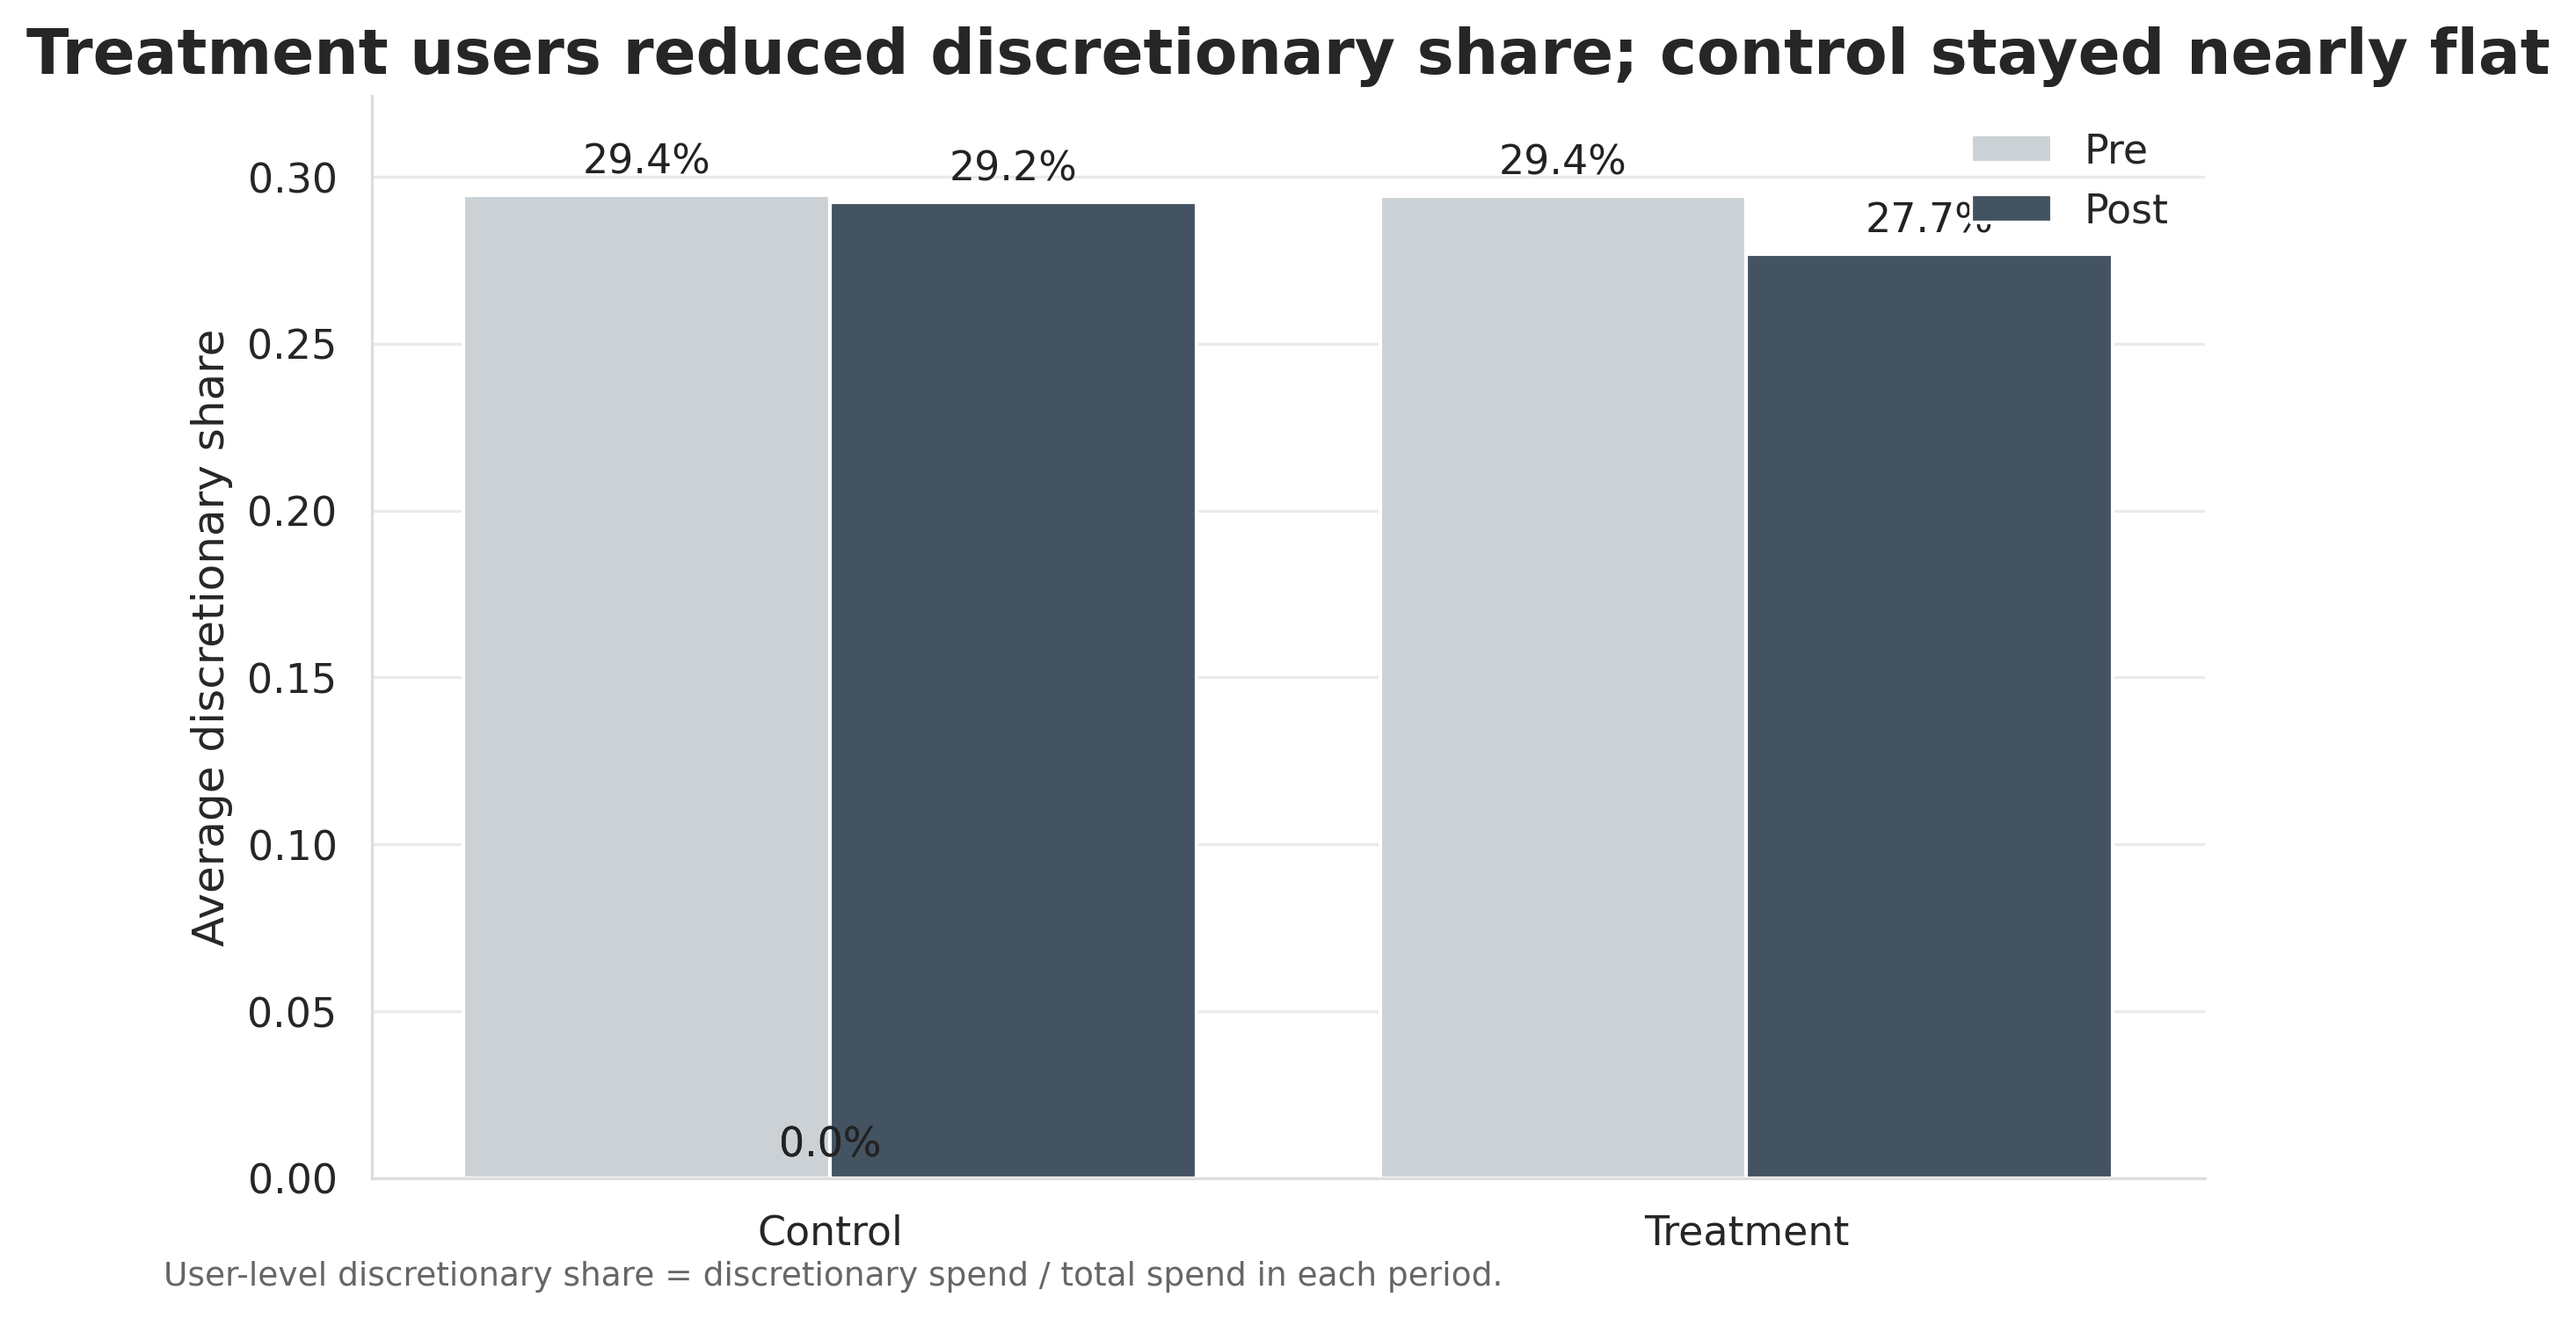
1. Primary effect: discretionary share decreased. In the control group, discretionary share barely moved, from 29.44% to 29.23%. In the treatment group, the change was more pronounced: from 29.42% down to 27.69%. The diff-in-diff effect was −1.53 percentage points, with a 95% confidence interval from −2.03 to −1.02 p.p., which supports interpreting the effect as both statistically and practically meaningful for a product intervention.
This is an important result from a fintech perspective. The feature did not try to “ban spending”; its goal was to slightly shift the spend mix. This type of effect is realistic and valuable in a product that works not via sanctions, but via salience, framing, and soft nudges.
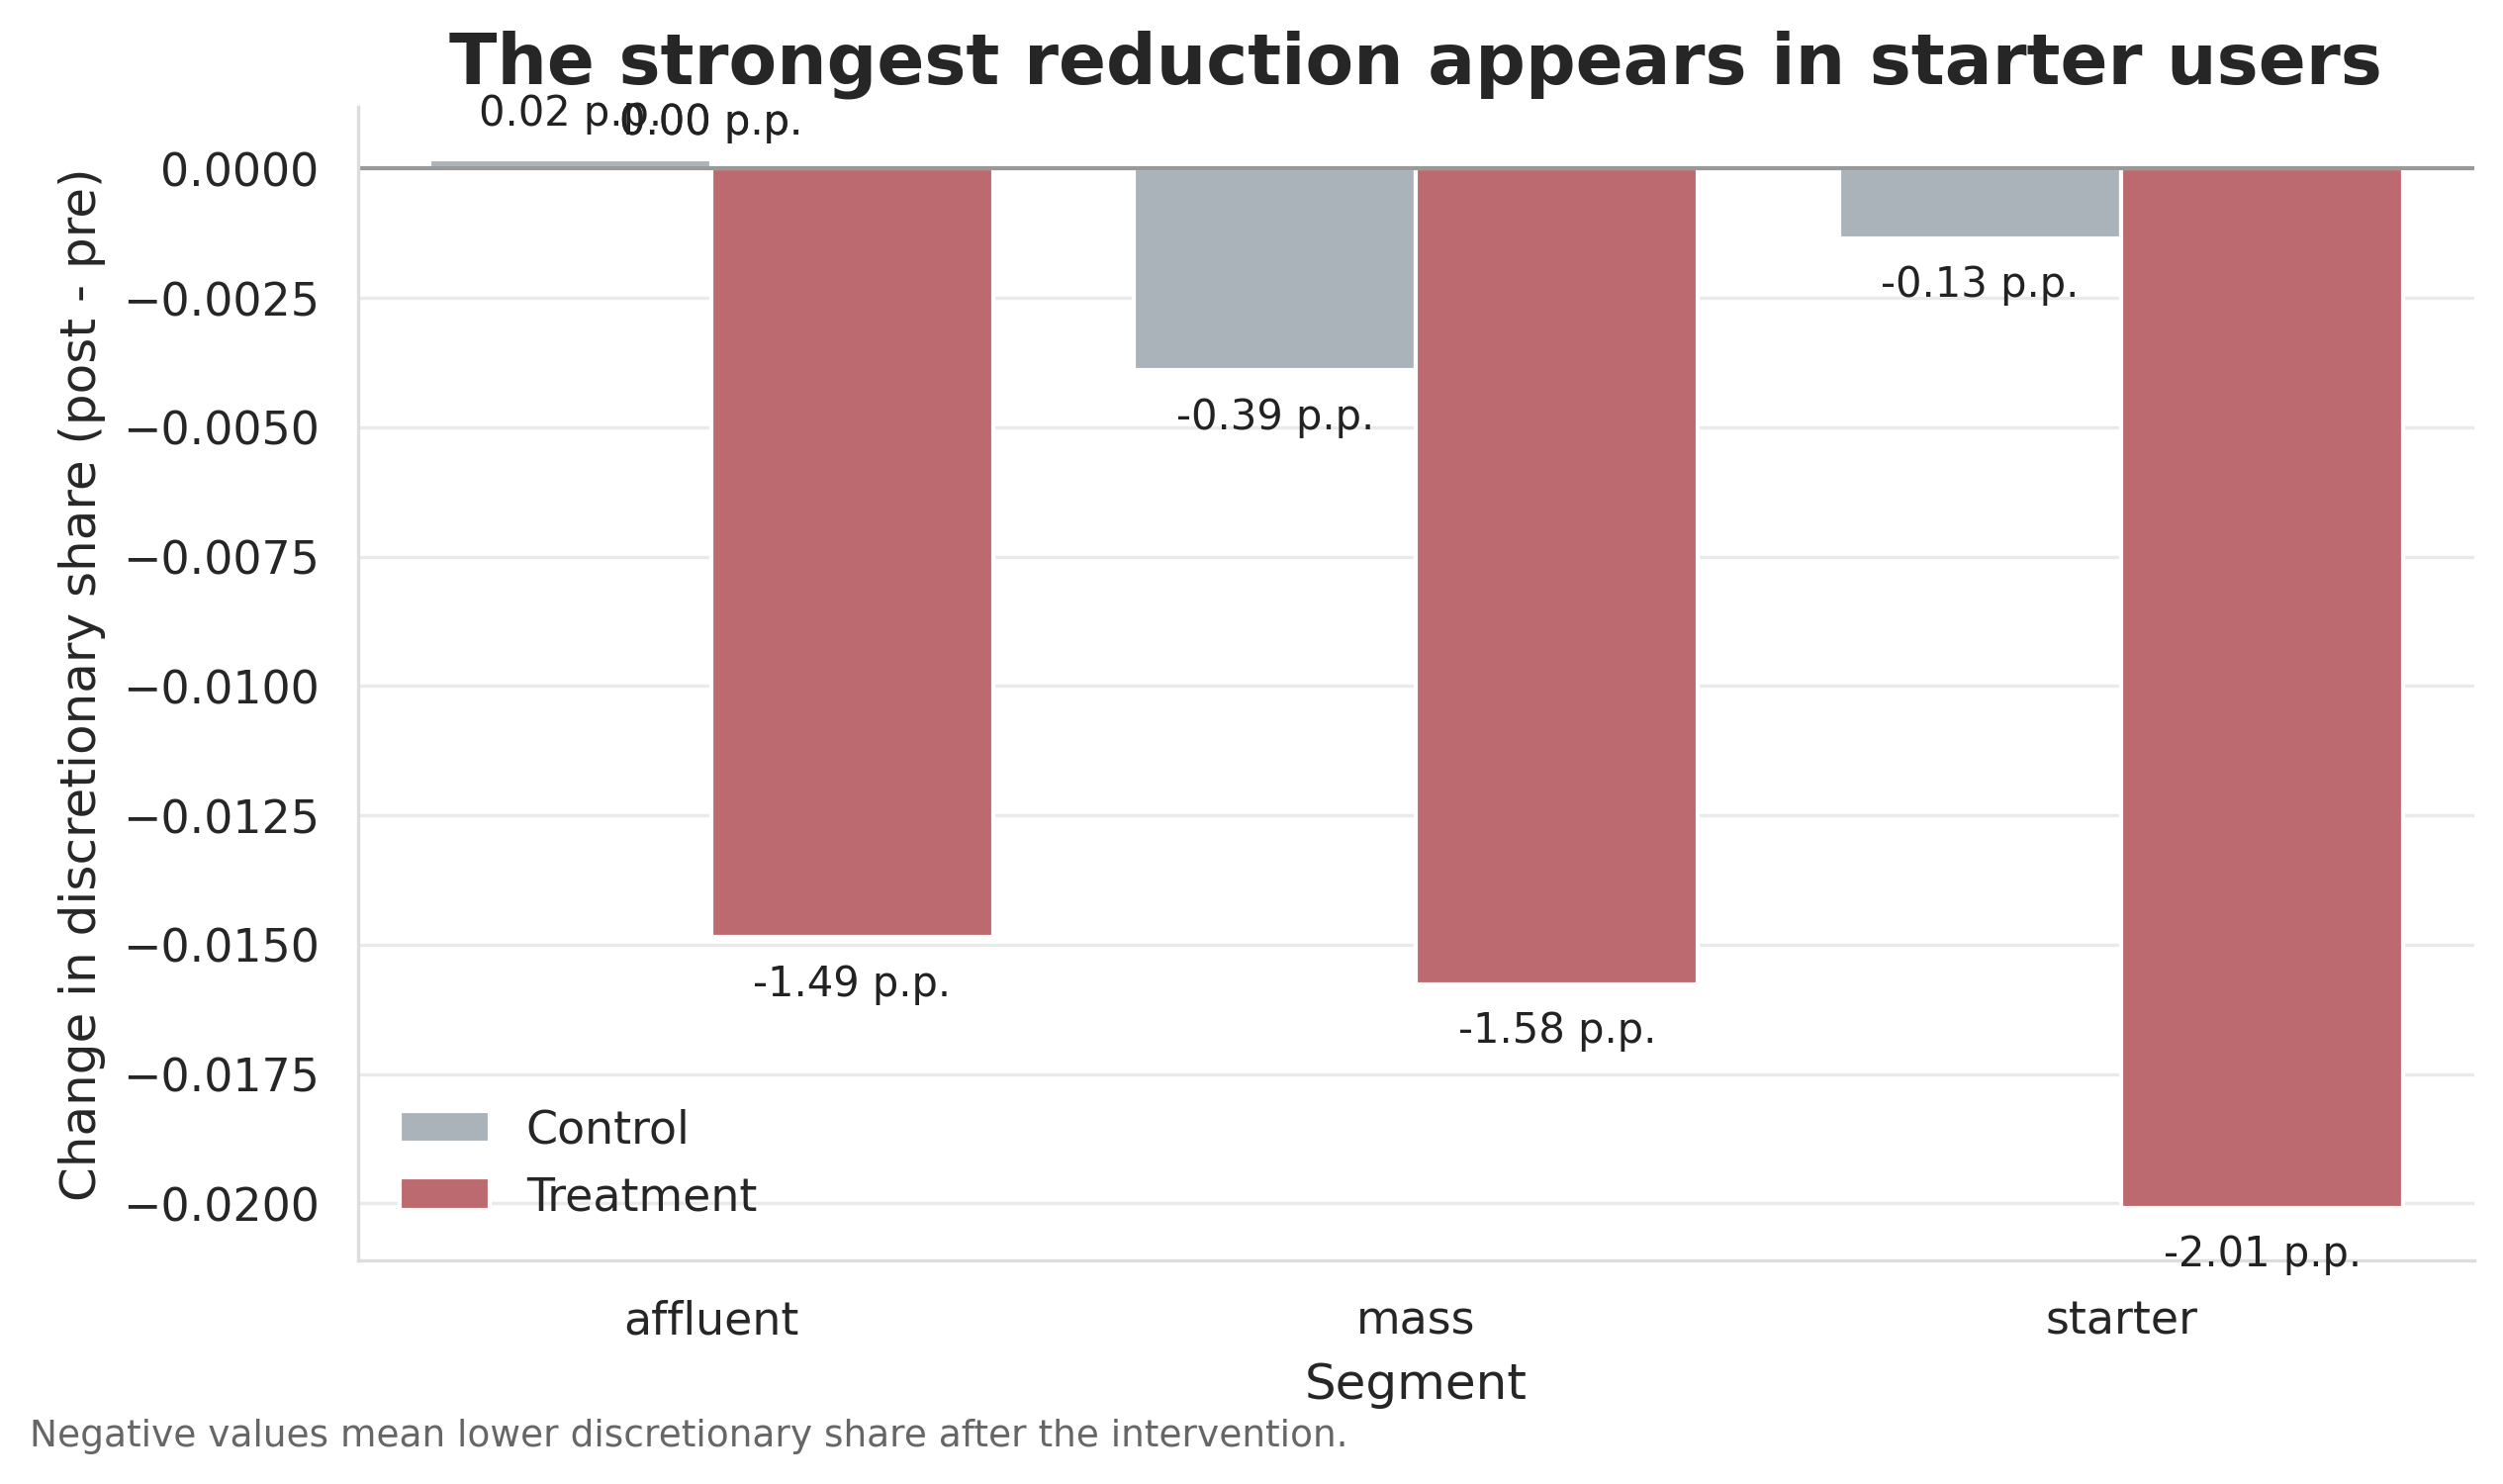
2. Heterogeneity: the effect was not uniform. Segment analysis showed that the treatment did not work equally for everyone. The strongest effect appeared among starter users, with a reduction of about −2.01 p.p., while for mass it was about −1.58 p.p., and for affluent about −1.49 p.p.
3. Guardrails: essentials and engagement did not decline. One of the most important conclusions of the case is that the primary effect was not bought at the cost of harmful side effects. Essential share did not show a dangerous decline, and transaction count remained stable across groups.
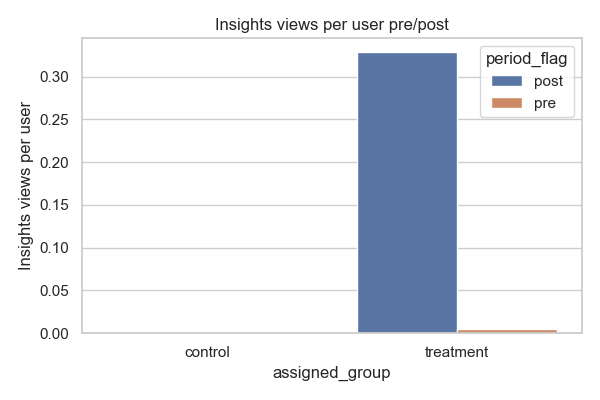
Even more importantly, app usage did not decline. Sessions per user remained stable, while views of the insights screen actually increased where the treatment was adopted.
4. Adoption and mechanism: the feature did not work on its own. Adoption analysis showed that the feature was not adopted randomly. The strongest directional predictor was goal_orientation_score with an odds ratio of 2.315 and a 95% CI of [1.092, 4.906]. Other coefficients were directionally consistent with expectations: financial_stress_score and trust_in_ai_score had positive signs, while avoidance_tendency_score had a negative sign.
In practical terms, this means something simple: this kind of feature works best not equally for everyone, but where there is readiness for goals, a search for control, and willingness to engage with digital advice. This is an important conclusion for product strategy: behavior-change features should not only be launched, but also targeted and personalized.
What this means for the business
The statistical effect in this article is not an end in itself. The real question for a fintech business is whether the feature creates a useful shift in user behavior without creating a new source of friction.
In the post period, the average spend per user over 3 months was 5,609.63, while the incremental reduction in discretionary share was 1.53 percentage points. This gives an estimate of about 85.65 in reallocated spend per user over 3 months. At a scale of 100,000 users, this is approximately 8.57 million per quarter or 34.26 million on an annualized basis.
This figure should not be interpreted as direct bank revenue. Its correct interpretation is behavioral reallocation away from discretionary categories. For a bank, this may mean stronger positioning as a partner in financial wellbeing, a better foundation for future products in savings, investing, and coaching, and a potential reduction in risks associated with unstable customer behavior.
Decision rules for rollout. A broader rollout only makes sense if discretionary share declines with statistical significance, while essential share, sessions per user, and days active do not send a negative signal. It is logical to start scaling in the segments where the signal is already strongest — in this case, starter and goal-oriented users. After that, separate tests are needed for tone of voice, frequency, and framing for FOMO-sensitive, avoidance-prone, and stress-driven profiles.
How this can be applied in your product
The value of this case is not limited to a mobile banking app for the mass retail segment. The logic of behavior-based spending insights can be adapted to different types of fintech businesses.
- Neobanks and mobile banks. This case can serve as a basis for launching a lightweight layer of financial prompts on the home screen, in the inbox, or through push communication.
- PFM, budgeting, and money coaching apps. The case can be adapted into a deeper level of personalization through profiles such as goal-oriented, stress-driven, avoidance-prone, and FOMO-sensitive.
- Investment apps, wealthtech, and brokerage products. The same logic transfers to impulsive investing, panic decisions, overtrading, and reactions to volatility.
- BNPL, lending, and credit products. The approach can be used as an early risk-prevention layer through alerts, budgeting prompts, adaptive communication, and preventive behavioral design.
Based on this logic, other cases can also be built: savings nudges and emergency fund formation, overspending alerts versus avoidance behavior, and behavioral segmentation for credit or BNPL risk prevention.
15 free minutes for banks and fintech apps. If you need to understand how behavioral analytics, AI insights, or experiments of this type could be useful in your specific product, we can briefly discuss the task, the data, and the potential points of influence.
Case limitations
This case is not a production experiment on real banking data. All users, transactions, and latent traits are synthetic and were created as an analytical model. Therefore, the numerical results here should be interpreted as a research demonstration of proper design logic, not as a literal forecast of what would happen in a bank.
In addition, the latent traits in this case were modeled rather than directly measured. This means they work well for explanatory and demonstrative design, but in a product they would require proxy indicators, survey linkage, observed behavioral signals, or a separate measurement layer.
Another limitation is the time horizon. Even if the feature lowers discretionary share on average over 3 months, this does not yet mean a long-term change in habits. A real product would need additional waves of experiments: personalization of message framing, frequency control, long-term retention analysis, and a check for whether a delayed avoidance effect emerges.
Conclusion
The main conclusion of the case is simple: AI-based spending insights can be a useful fintech feature if they are designed as a behavioral intervention rather than just another dashboard. In the simulated A/B experiment, they reduced discretionary share, did not hurt essential spend, did not reduce engagement, and worked best where users already had at least a minimal internal frame of goals and control.
For the product, this means the next level of maturity is not simply launching nudges for everyone, but personalizing them by readiness, stress level, goal orientation, and style of digital interaction. It is precisely at the intersection of behavioral finance, product analytics, and thoughtful experimentation that real value for fintech services is created today.
If your product has the task of reducing undesirable user behavior, improving the effectiveness of financial insights, or understanding how behavioral interventions can affect key business metrics, a study like this can be adapted to your context, your data, and your product decisions.